Phase Diagrams: Types and Examples
Introduction to Phase Diagrams
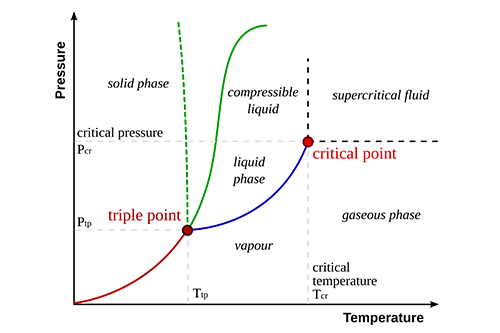
Phase diagrams are essential tools in chemistry and materials science, providing a graphical representation of the physical states of a substance under different conditions of temperature and pressure. These diagrams help scientists and engineers predict the behavior of materials during processes like heating, cooling, and compression.
The States of Matter
Understanding the three primary states of matter—solid, liquid, and gas—is fundamental to interpreting phase diagrams.
Solid
In the solid state, molecules are tightly packed in a fixed structure, resulting in a definite shape and volume. Solids have high density and low entropy compared to liquids and gases.
Liquid
Liquids have a definite volume but take the shape of their container. The molecules in a liquid are less tightly packed than in a solid, allowing for fluidity and higher entropy.
Gas
Gases have neither a definite shape nor volume. Molecules are widely spaced and move freely, leading to the highest entropy among the three states.
Key Features of Phase Diagrams
Phase diagrams typically include several key features:
- Triple Point: The unique set of conditions where solid, liquid, and gas phases coexist in equilibrium.
- Critical Point: The temperature and pressure beyond which a gas cannot be liquefied.
- Phase Boundaries: Lines that separate different phases, indicating the conditions under which one phase transforms into another.
Importance of Phase Diagrams
Phase diagrams are crucial in various applications, including:
- Material Science: Designing materials with specific properties by controlling their phase during processing.
- Meteorology: Understanding atmospheric conditions and weather patterns.
- Chemical Engineering: Optimizing reactions and separations by controlling temperature and pressure.
Phase Diagram Table
|
Phase Region |
Characteristics |
Example Conditions |
|
Solid |
Fixed shape and volume, low entropy |
Ice at 0°C and 1 atm |
|
Liquid |
Definite volume, shape adapts to container |
Water at 25°C and 1 atm |
|
Gas |
No fixed shape or volume, high entropy |
Water vapor at 100°C and 1 atm |
|
Triple Point |
All three phases coexist |
0.01°C and 0.006 atm for water |
|
Critical Point |
Beyond this point, liquid and gas phases are indistinguishable |
374°C and 218 atm for water |
For more information, please check Stanford Advanced Materials (SAM).
Frequently Asked Questions
What information can I obtain from a phase diagram?
A phase diagram shows the stability of different phases (solid, liquid, gas)
under various temperatures and pressures, helping predict material behavior.
How is the triple point significant in phase diagrams?
The triple point is where solid, liquid, and gas phases coexist in equilibrium,
providing unique conditions for studying phase transitions.
What happens at the critical point on a phase diagram?
At the critical point, the distinction between liquid and gas phases
disappears, resulting in a supercritical fluid with unique properties.
Can phase diagrams be used for mixtures or only pure substances?
Phase diagrams can be constructed for both pure substances and mixtures, though
diagrams for mixtures are more complex due to additional variables.
How are phase diagrams useful in industrial applications?
They help in designing processes like crystallization, distillation, and
material synthesis by predicting phase changes under different conditions.